JJRadiator Month 1 Report: First 10 Days of Google Search Console Data for an AI-Built Export Site
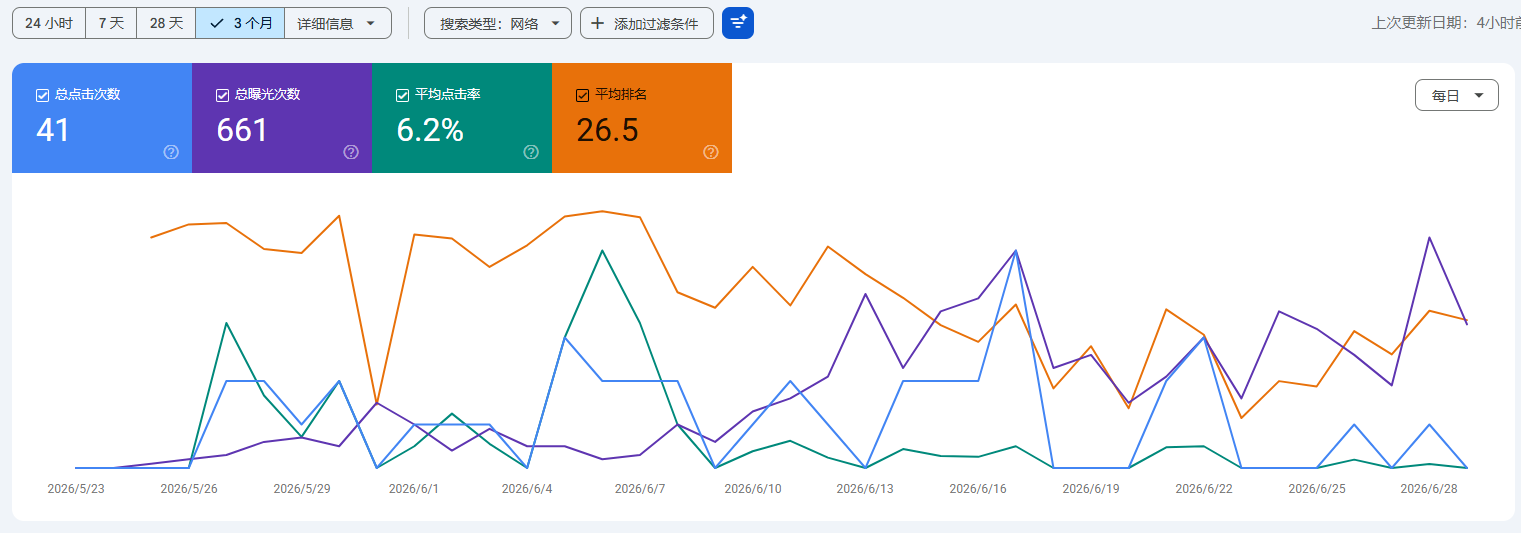
I launched jjradiator.com with 15,000+ AI-generated product pages on June 21. Ten days later, Google Search Console shows 41 clicks, 661 impressions, and a 6.2% CTR. The numbers are small. That is the point — I am publishing them anyway.
Why I Am Publishing Numbers This Small
Most people wait until they have impressive data to show. I am doing the opposite.
jjradiator.com went live around June 21, 2026. It is an auto parts export website — radiators, condensers, intercoolers — built by me, a TCM practitioner with no programming background, using Claude and DeepSeek after work hours.
The site has over 15,000 product records. Each product page was generated through an AI pipeline: PDF catalog → vision extraction → structured JSON → HTML template → published page. I documented that workflow in a separate article (How I Built a 15,000+ Product Database for Under $1).
Ten days in, the data is small. 41 clicks. 661 impressions. These are not vanity metrics. They are a baseline.
I am publishing them now because the most useful part of a case study is not the ending. It is the beginning — when the numbers are unimpressive, the decisions are uncertain, and the reader can see whether the approach actually works over time.
This is the first monthly report. There will be more. Some will be boring. Some will show progress. Some will show regression. All of them stay public.
The Baseline Snapshot: June 23 vs July 1
I took two Search Console screenshots in the first 10 days. Here they are side by side:
| Metric | June 23 (Day 2) | July 1 (Day 10) | Change |
|---|---|---|---|
| Clicks | 34 | 41 | +20.6% |
| Impressions | 395 | 661 | +67.3% |
| CTR | 8.6% | 6.2% | -2.4pp |
| Avg Position | 23 | 26.5 | -3.5 |
The headline numbers look mixed. Clicks and impressions are up. CTR and average position are down. But in context, this is exactly what you would expect from a brand-new site in its first week.
Here is why each number moved the way it did:
- Impressions +67.3%. Google is discovering more pages. The sitemap was submitted on day one. The crawl is ongoing. More indexed pages = more opportunities to appear in search results = more impressions. This is the number I am watching most closely right now.
- Clicks +20.6%. Clicks grew, but slower than impressions. That is normal for a new site where Google is still figuring out which queries to match your pages against. Some of those impressions are for irrelevant queries. The click-worthy ones lag behind.
- CTR down from 8.6% to 6.2%. This looks bad but is actually expected. When a site is tiny (day 2), the few impressions it gets tend to be from very specific, brand-like queries — which have high CTR. As the site gets indexed for broader, more competitive queries, CTR naturally drops. A 6.2% CTR at position 26.5 is actually decent.
- Average position dropped from 23 to 26.5. Same dynamic. Early on, Google only showed the site for queries it was confident about — hence a better average position. As more pages enter the index for a wider range of queries, the average position drifts down. This is a volume effect, not a penalty.
None of these numbers are impressive on their own. Taken together, they tell a clear story: Google is discovering the site, testing it against different queries, and the site is earning a small but real trickle of clicks. That is the only thing a 10-day-old site should be doing.
What Is Actually on the Site
It helps to know what Google is crawling. jjradiator.com is not a blog. It is a product catalog:
- 15,000+ product pages. Each page is a radiator, condenser, or intercooler with part numbers, dimensions, vehicle fitment, and a product image. These are generated pages — AI extracted the data, a template renders the HTML. Not hand-written. Not spun content. Structured data served through consistent templates.
- Basic SEO structure. Every product page has a title tag, meta description, H1, alt text on images, and internal links to category pages and related products. Nothing fancy. Nothing spammy. Just the fundamentals done consistently across a large number of pages.
- Contact/inquiry path. Product pages include a "Request a Quote" call-to-action. This is the conversion goal. Not ad revenue. Not affiliate clicks. Direct B2B inquiries.
- No blog. No backlinks. No domain authority. This is as close to a cold start as you can get in 2026. A brand-new domain, zero referring domains, zero content marketing, just product pages and basic SEO.
If this site gets meaningful traffic in month 3 or month 6, it will not be because of clever growth hacks. It will be because 15,000 well-structured product pages, indexed and ranking for long-tail part-number queries, can compound without much additional effort.
Or it will fail, and I will publish that too.
What I Changed in the First 10 Days
I did almost nothing. Deliberately.
The first two weeks after launching a new site are not for optimization. They are for observation. Google needs time to crawl, index, and start ranking pages. Making changes too early means you cannot tell whether what you are seeing is the result of your changes or just Google's normal discovery process.
Here is what I did do:
- Submitted the sitemap. Day one. 151 URLs submitted through Google Search Console.
- Checked index coverage. Watched which pages got indexed and which did not. No manual requests. Just monitoring.
- Verified basic on-page elements. Made sure title tags, meta descriptions, and H1s were rendering correctly across a random sample of product pages.
- Took screenshots. June 23 and July 1. That is it. No A/B tests. No content rewrites. No link building.
At this stage, the best thing you can do for a new site is not break anything and let Google do its job.
Things That Could Go Wrong From Here
I am not optimistic by default. Here is what I am watching for:
- Index bloat. 15,000 pages is a lot for a new domain. If Google decides the pages are low-quality or too similar, it may index only a fraction of them — or index them and not rank them. The impression growth in week one is encouraging, but it could flatten quickly.
- Thin content penalty (real or perceived). Product pages with only specifications and fitment data are not "rich content" by Google's standards. If the pages are too thin, rankings may stall. The counterargument: many B2B parts sites rank fine with exactly this kind of content, because buyers searching for "16400-0T020 radiator" do not want a blog post — they want the part.
- No backlinks, no authority. A site with zero referring domains is invisible for competitive queries. Long-tail part numbers might rank on content relevance alone. Anything broader ("auto radiator supplier") will not move without authority signals. Those take months or years.
- Craw budget limitations. Google does not crawl 15,000 pages overnight for a new domain. It prioritizes. Some pages will not be crawled for weeks or months. That is fine — the catalog does not change daily — but it means the "full picture" of rankings will take time to emerge.
I will report on all of these in the next monthly update.
The Next Snapshot: July 8
I am taking the next Search Console screenshot on July 8, 2026 — roughly two weeks after launch. By then:
- More pages should be indexed.
- The impression curve should show whether growth is accelerating, linear, or flattening.
- Click data will be more meaningful — 14 days of data is still small, but twice as useful as 7 days.
- Query data should start showing which search terms are sending impressions. This is the most important signal: what is Google matching my pages against?
If the data shows something interesting, I will publish a week-2 update. If nothing changes, I will wait until the full month-1 report and explain what a "boring" month looks like in practice. Boring months are part of the story too.
If You Are Building Something Similar
If you are launching a product-heavy B2B site with AI-assisted content, here is what I would tell you based on 10 days of data:
- Publish your baseline early. Do not wait until the numbers look good. The baseline — when the data is small and unimpressive — is what makes future growth credible. Anyone can publish a success story after the fact. Very few people publish the first two weeks.
- Watch impressions, not clicks, in the first month. Clicks will be tiny. That is fine. Impressions tell you whether Google is discovering and testing your pages. No impressions = your pages are not in the index or your queries have no search volume. Fix that first.
- Do not optimize yet. If you change title tags and rewrite content in week one, you cannot tell whether your changes helped or Google was going to rank you differently anyway. Observe first. Act second.
- Structure matters more than word count. 15,000 thin product pages with consistent templates, proper title tags, and clean internal linking will outrank 50 "comprehensive guides" for long-tail part-number queries. The buyer searching "16400-0T020" does not need a blog post.
This project is public. The data stays public. If it works, you will see the proof. If it fails, you will see that too. Either way, it is more useful than a retrospective written after the outcome is already known.
→ Follow the next update: Live Stats Dashboard — the same Search Console screenshots, updated with each new snapshot.
→ Read the build log: AI Export Lab — every article in this experiment, in order.